Why we created JTrack
This is a blog post about why we created JTrack. JTrack is a workflow automation suite designed for small businesses to turn their complex business processes into interactive flowcharts.
I've been building software for a number of years, in many different contexts. I've worked for large government organisations, series A startups and I've delivered software projects for several small businesses. Prior to this, I spent ten years working as an engineer in the manufacturing industry. In that time, I've noticed a recurring pattern: the problems across these environments are often similar, so the solution should be too.
A Case Study
When I worked at Jaguar Land Rover, I was part of the team responsible for keeping the machining lines up and running as well as consistently reducing scrap levels, improving efficiency and making sure that we fulfilled our reporting and traceability obligations.
The core of any good manufacturing operation (and arguably any business operation), is defining a process and delivering on it repeatably. At Jaguar Land Rover, we had several robust systems for what I would call our 'happy path'. In this case it was machining conforming parts and sending them to the customer.
However, every system has edge cases, and driving down these edge cases was the core of my role. In order to manage these cases we needed to track them, collect data and report on the outcome. Some examples of this were:
- Recording manual measurement and rework processes.
- Our 'hold, sort, release' process, tracking non conforming parts and either scrapping them or getting them back to line.
- Process improvement tasks, such as Kaizens.
- Engineering change management.
In all these cases, we needed a system where we could define the steps in our process and allow anyone, or a group of people, to follow them through independently. We then wanted to aggregate and collect this data to use in analytics or reporting.
Such a system was remarkably difficult to find. We ran up against a number of issues with each of the options we found:
- A given software system was tailored to one specific use-case, and didn't allow us the freedom to alter that process to suit our needs. This meant at best we needed to onboard one system per process, and at worst meant we were constantly trying to fit a square peg into a round hole, bending our process to suit the tool, instead of the other way around.
- The software wasn't self-serve. By self-serve here I mean a system where we could onboard ourselves, build out and change our own processes and keep the software useful as our process changed.
- For most options, we had to endure a 'call our sales guy' process followed by a lengthy onboarding process and expensive consultants to get anything done. We were clever people, and simply wanted the tools to define and modify our own standards.
Invariably, we went back to the same old tools. Usually, it was an over-engineered Excel spreadsheet with 8,000 lines of macros that broke the moment someone saved it in the wrong place on the shared drive. If we were feeling particularly motivated we'd spend a week fighting MS Access for some sort of database functionality.
After moving into software, I saw this same pattern again and again. People seemed to be crying out for something just as flexible as an excel spreadsheet but with:
- Better error handling and validation.
- A web-based, cloud native approach meaning everyone could use the system at the same time.
- No-code and no formulae, just business rules in an easy-to-access format.
- A 'what can I build in an afternoon for £20' mentality rather than a 'lets get some expensive consultants to spend half a million and deliver no value' mentality.
Interactive Flowcharts
As an engineer, your mind is trained to think in flowcharts. We use them all the time to define and understand our processes. So if we're creating those flowcharts anyway, what if they could be interactive? What if you could move through the flowchart as you move through the process, completing the steps and entering the right data as you go?
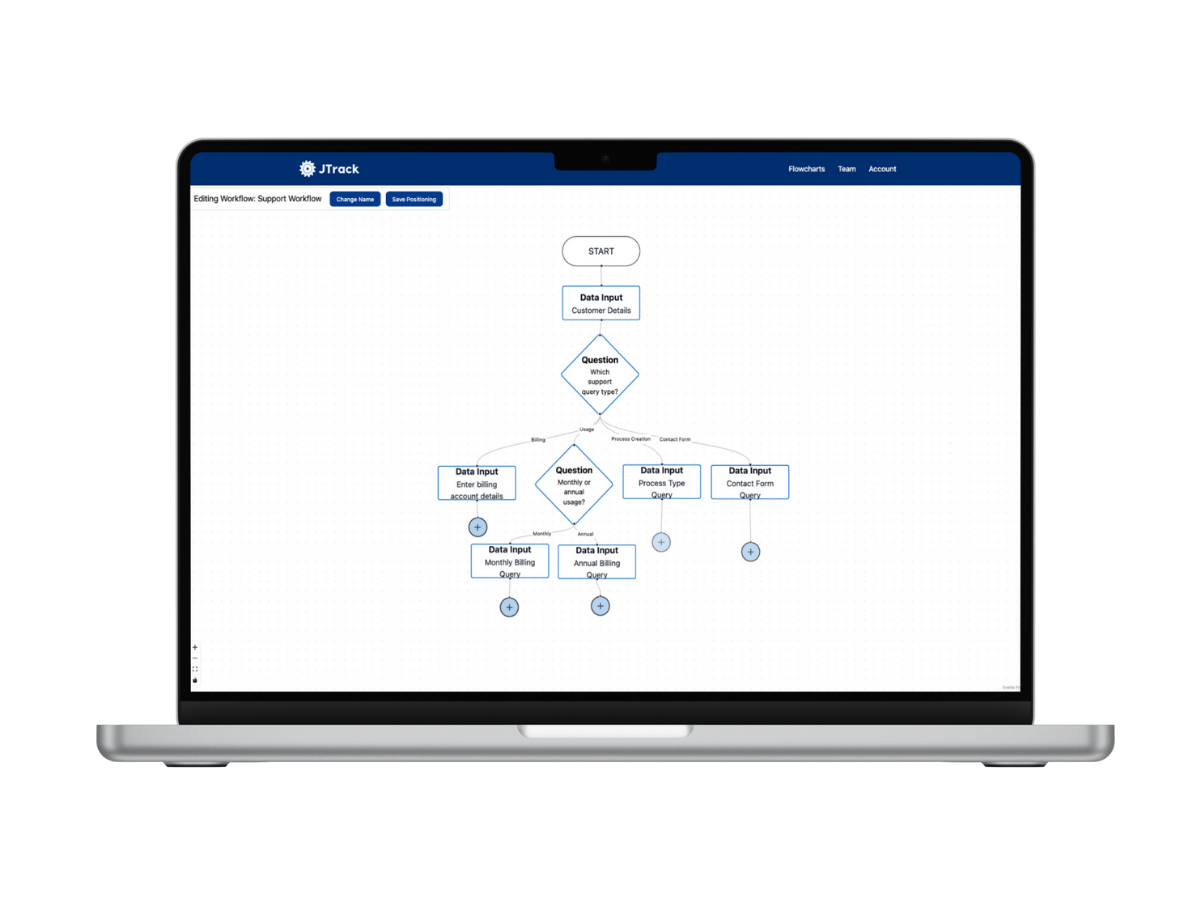
hat idea became the foundation for JTrack. It's simple: you map out a process by using a series of pre-defined step types, create content for each of those steps and then you can run the flowchart.
For example, in our scrap process we'd have an initial step for collecting the information about the part. This would be a data input step, and we'd create the form to collect the data we need right in the step itself. When you run the step, you enter the data as defined and the data is saved to be used later.
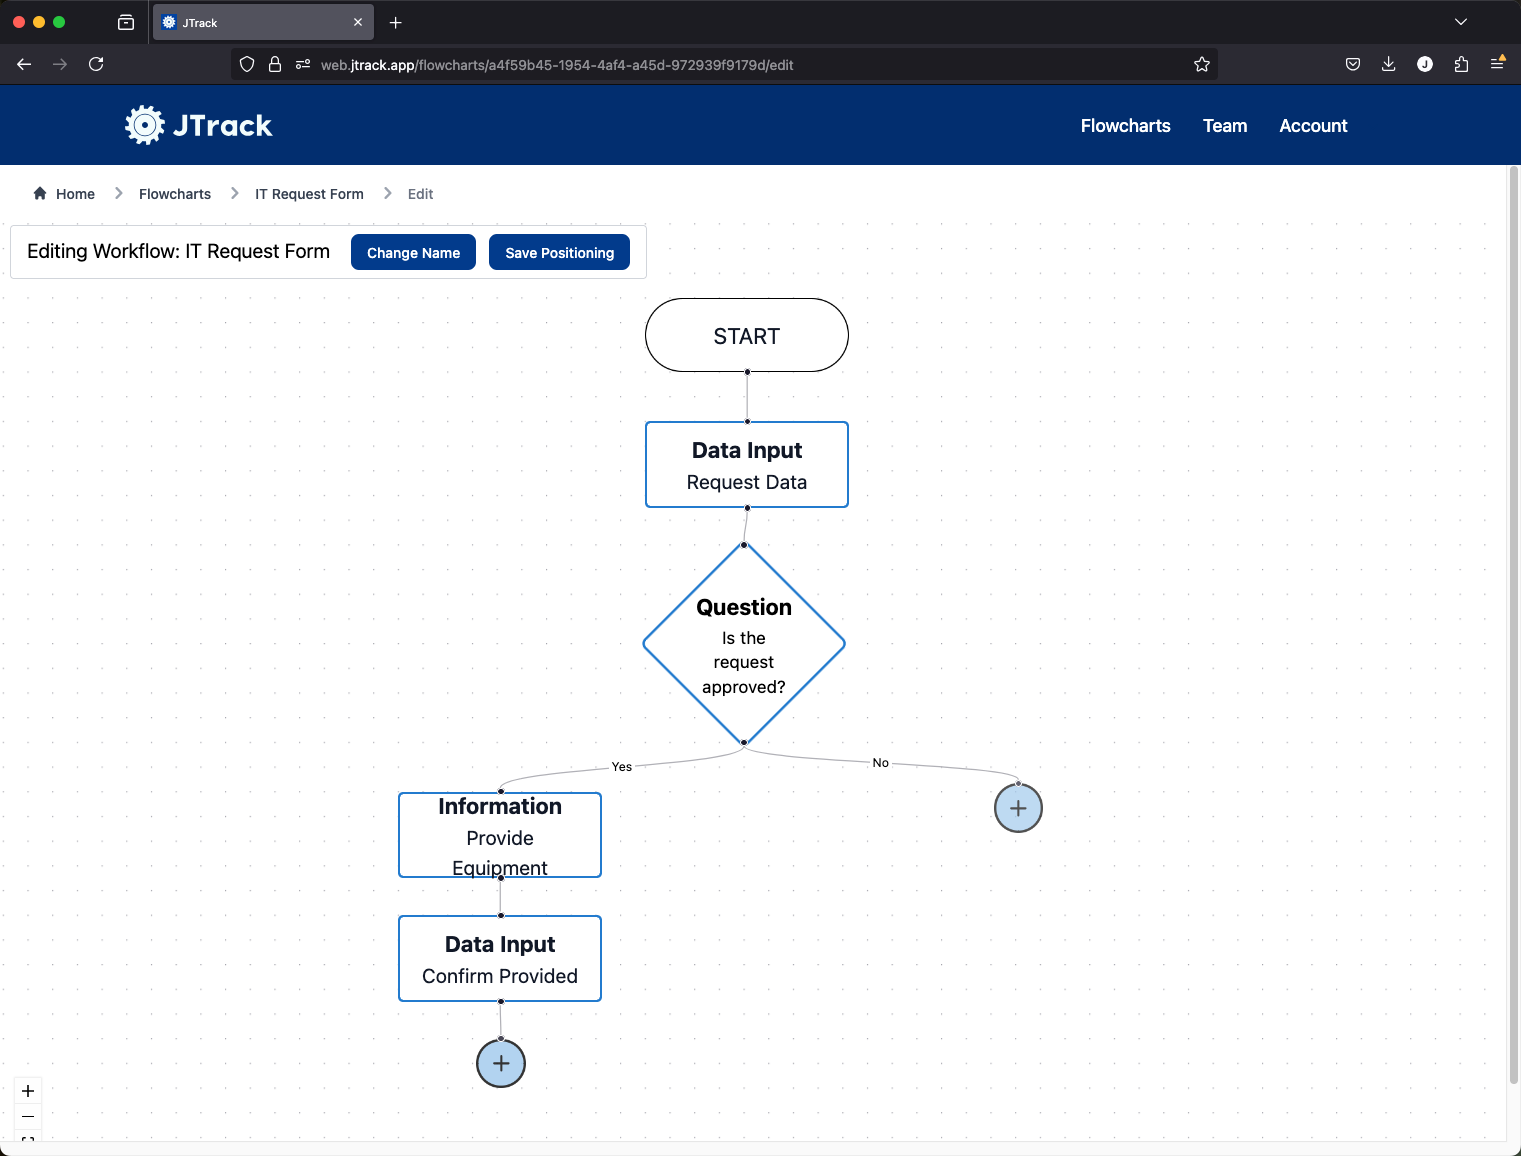
Another key element was branching logic. Processes in real life are rarely linear and have a number of 'if this, then that' type statements. A typical example in a scrap process would be the engineer or quality team determining if the part is OK or not.
JTrack's question steps make that easy. You can define a question 'Is the part OK?' and the user answers with a yes or a no. The logic then branches based on the answer to this question. For yes, the operator puts the part back on the line, for no, the part is scrapped off as per the rest of the process.
You can see how easy this is to do over on the JTrack website.
Naturally, you would only want certain parts of this flow to be runnable by certain people. So JTrack allows you to assign permissions to each step.
Data Collection and Review
Getting data into the system is only half the battle. What's arguably more important is being able to get it back out and analyse it to monitor and improve your process.
The first way JTrack handles this is with a fully customisable table view. We recognised each person within the business might have a different idea of what data is important to them. For this reason, JTrack allows you to customise your view of the data by adding or removing columns, filters and sorting. This view is personal to you, so each user gets their own table view.
Of course, as well as viewing individual records you want to be able to create aggregates on the data as well as charts and dashboards, without going back to Excel every week.
To satisfy this need, we're planning on building a fully customisable dashboard builder into JTrack so you can get instant answers to questions like 'What was our top scrap code this week?' or 'How many parts have been made in the last hour?'
We're really proud of what we've built so far, and would love to hear your feedback. JTrack has a generous free tier and a number of common templates so you can get started in minutes today. Click the button below to try it today.